Whitepaper
Beyond Traditional Packages
How Go, Rust, and AI Artifacts are Reshaping Enterprise Dependencies
Executive Summary
Today’s enterprise repository is asked to manage a different software supply than it was built for a decade ago. Modern development increasingly draws from newer language ecosystems, rapidly expanding package formats, and AI artifacts. Modern inputs are moving from public ecosystems into enterprise infrastructure faster than many organizations may realize.
Three artifact ecosystems offer distinct vantage points on that transition. Go shows what happens when a newer ecosystem becomes established enterprise infrastructure. Cargo shows an ecosystem where public supply and enterprise adoption are accelerating together. Hugging Face shows an entirely new class of artifact, AI models and related assets, entering the same enterprise systems and governance workflows historically built around software packages.
Sonatype Research Labs analyzed public ecosystem activity alongside anonymized enterprise repository and policy telemetry to follow that transition across three stages: what public ecosystems are producing, what enterprises are actually consuming, and what enterprise policies are being asked to govern. Policy activity comes from a separate, smaller set of measured customers than repository adoption; the populations and rates are not directly comparable.
Together, the three ecosystems show that there is no single path from emerging technology to enterprise dependency, but the direction of travel is clear:
- Go is already established in enterprise environments, appearing in 15.6% of the measured population, while public module creation and enterprise use continue to grow.
- Cargo is accelerating on both sides: new crate creation in H1 2026 was more than 3.6 times H1 2025, and measured enterprise adoption was nearly 4.9 times its Q2 2025 level in Q2 2026.
- Hugging Face adoption was nearly 4.7 times its Q2 2025 level in Q2 2026. Public model creation has been more volatile, showing why public supply and enterprise adoption should be read as different signals.
Adoption is becoming a governance problem, not just a repository-support problem. From H1 2025 to H1 2026, the share of audited Go requests blocked or rejected rose from 0.35% to 3.55%, while Cargo’s rate rose from 0.14% to 1.13%. For Hugging Face, 6.98% of audited requests in H1 2026 were blocked or rejected. These are policy outcomes in the observed populations; they do not show that one ecosystem is inherently riskier than another.
The definition of an enterprise dependency is changing. Artifact infrastructure has to be able to see, manage, and govern new inputs as they enter development, without waiting for each ecosystem to become ubiquitous first.
As modern software development evolves and expands, the artifact repository increasingly becomes the control point where enterprises see and govern that change.
The definition of an enterprise dependency is changing.
Go is Established, and Release Velocity is Rising
Go is the most established of the three ecosystems in this analysis, but its maturity has not slowed its growth.
For several years, new module creation was remarkably steady. Across each half-year period from H1 2023 through H2 2025, the Go ecosystem added roughly 28,000-32,000 new modules. In H1 2026, that pattern changed as Go added more than 54,000 new modules, an 83% increase over H1 2025 and the highest half-year total in the period analyzed.
Release activity has been rising even more consistently. New Go versions increased respectably for several years, from approximately 386,000 in H1 2023 to 1.39 million new versions in H2 2025. H1 2026 pushed that even further, with 1.43 million new versions published.
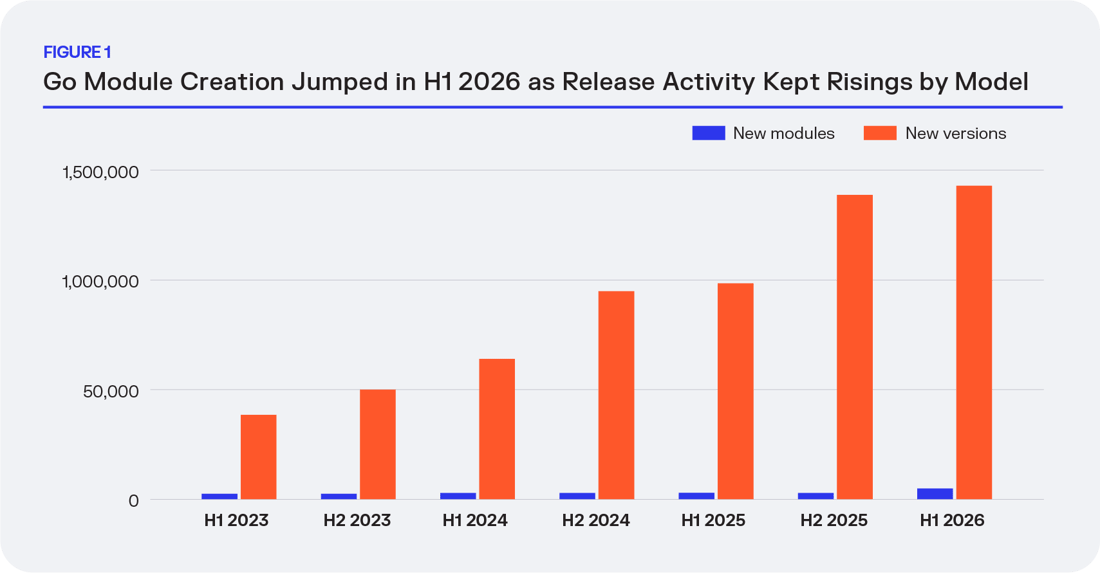
Figure 1: Go module creation reached more than 54,000 in H1 2026, an 83% increase from H1 2025, while new version activity continued its multiyear rise to 1.43 million.
Enterprise data shows that Go has already moved well beyond early experimentation, with Go claiming the largest enterprise footprint (15.6%) of the three ecosystems examined.
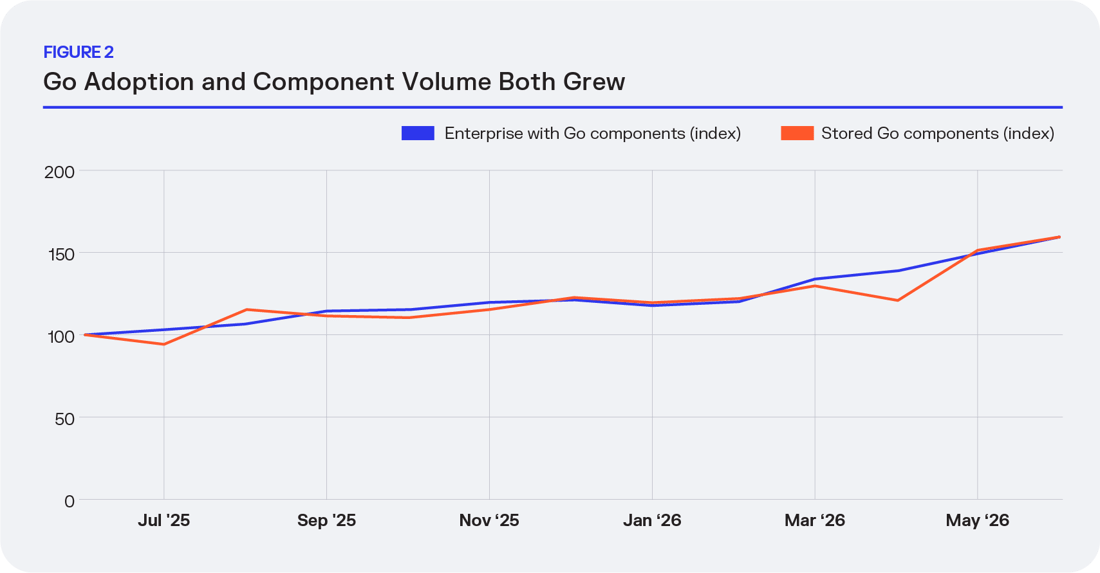
Figure 2: From June 2025 to June 2026, both the number of measured customers with Go modules and the volume of stored Go modules rose by about 59%. Line chart indexed to June 2025 = 100, showing monthly measured customers with at least one Go component and monthly stored Go components through June 2026.
Adoption is still expanding: from June 2025 to June 2026, the measured number of customers with Go modules and the volume of stored Go modules each increased by about 59%.
Financial services represents the largest share of observed Go adopters at 27.2%, followed by business services at 17.1% and software at 15.4%. Government accounts for 10.6% of observed adopters and Manufacturing for 8.2%, while the remaining 21.6% fall into other industries. This suggests that Go has become part of the development infrastructure of traditional enterprises as well as technology organizations.
Governance activity for Go modules increased in H1 2026. Audited requests totaled 481,707, compared with 783,803 in H1 2025. Blocked or rejected requests rose from 2,723 to 17,112, increasing the observed rate from 0.35% to 3.55%. These figures describe the measured policy population and do not establish why the rate changed.
Go is maturing and accelerating at the same time. It is already established inside enterprise repositories, but the ecosystem itself is becoming more active: release volume has climbed steadily for years, and new module creation accelerated sharply in H1 2026. For platform and security teams, supporting Go increasingly means keeping pace with both a growing stream of new modules and a faster-moving base of existing ones.
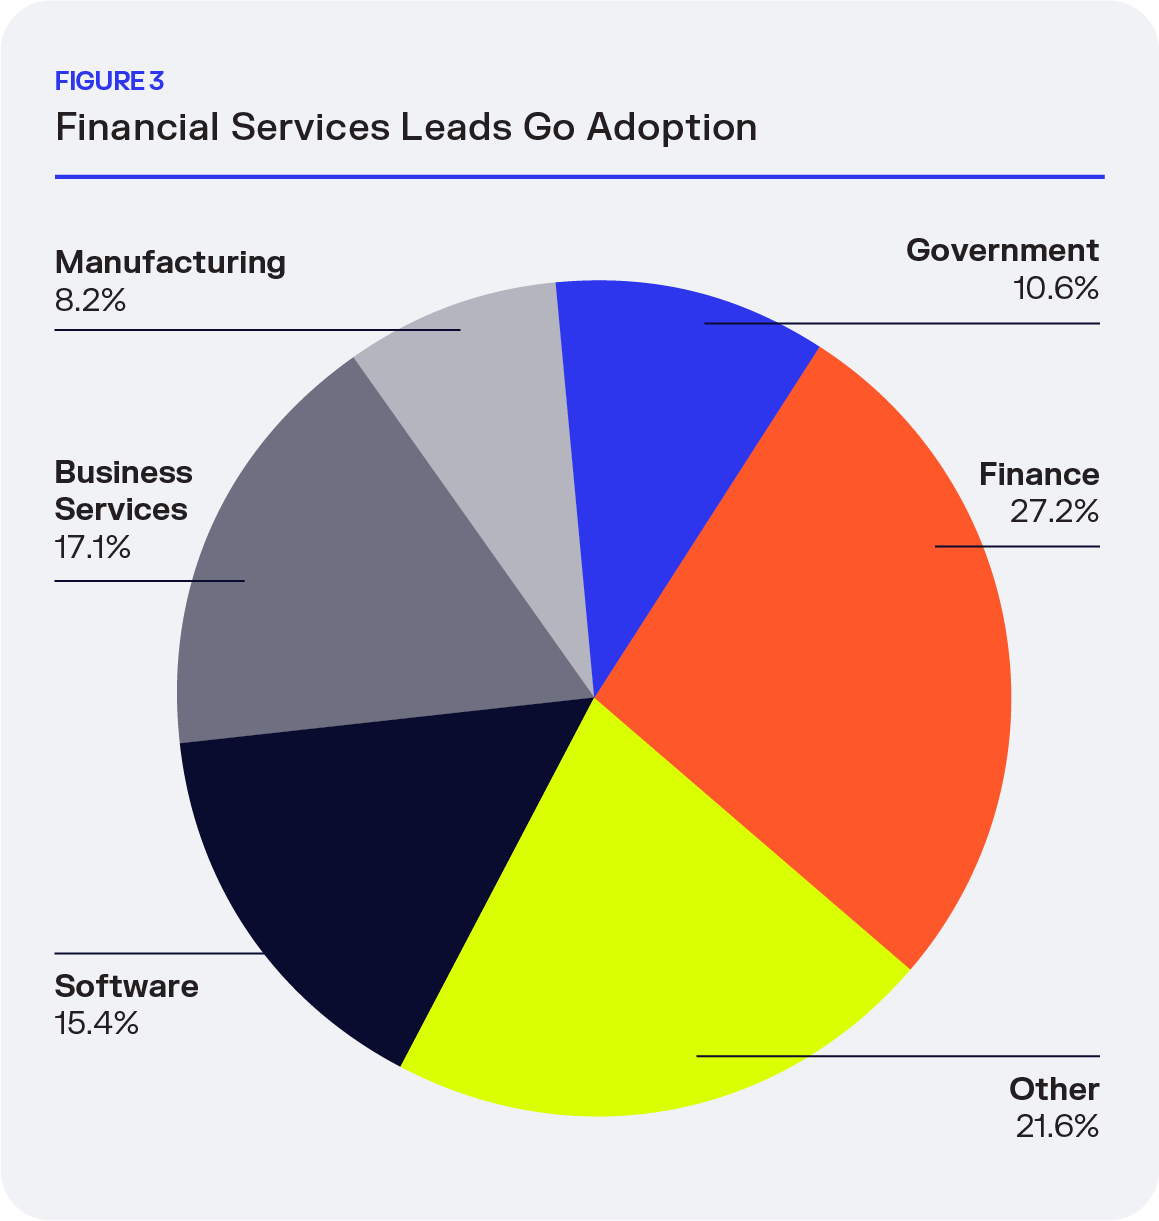
Figure 3: Financial services accounted for the largest share of observed Go adopters (27.2%), followed by business services (17.1%) and software (15.4%).
Rust is Accelerating Across Supply and Demand
Cargo, the Rust ecosystem, is moving into a much faster phase of growth.
From H1 2023 through H2 2024, Cargo added roughly 17,000 to 19,000 new crates every six months. Growth picked up in 2025, reaching more than 22,000 new crates in H1 and nearly 30,000 in H2.
Then H1 2026 marked a significant change. From January through June, the Cargo ecosystem added more than 81,000 new crates, more than 3.6 times the number published in H1 2025.
Release activity accelerated alongside crate creation; new Rust crate versions increased from roughly 141,000 in H1 2023 to 288,000 in H2 2025. H1 2026 produced more than triple the volume recorded a year earlier with over 745,000 new versions.
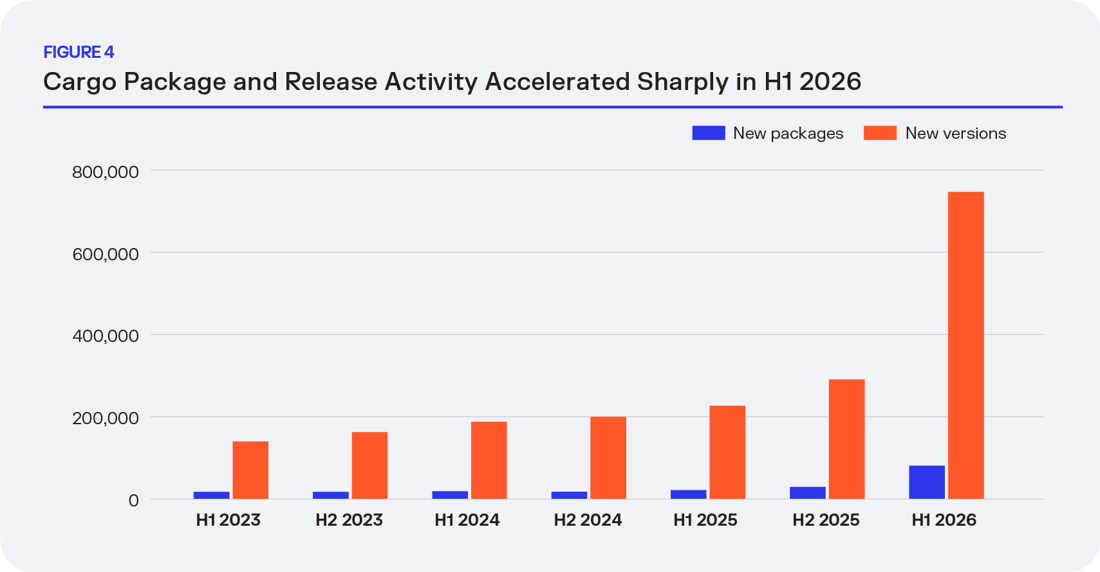
Figure 4: Cargo supply accelerated in H1 2026: more than 81,000 new crates were published, over 3.6 times the H1 2025 total, and new versions exceeded 745,000.
This demonstrates that the public ecosystem’s expansion is increasingly translating into operational enterprise use. More organizations are actively managing Rust crates as part of their development infrastructure, even as the ecosystem itself continues to expand rapidly.
Cargo’s enterprise footprint is also broadly distributed across industries. Software and financial services each represent roughly 19% of observed adopters, while business services and manufacturing each account for about 18%. That distribution suggests Rust adoption is extending beyond a narrow technology-sector footprint.
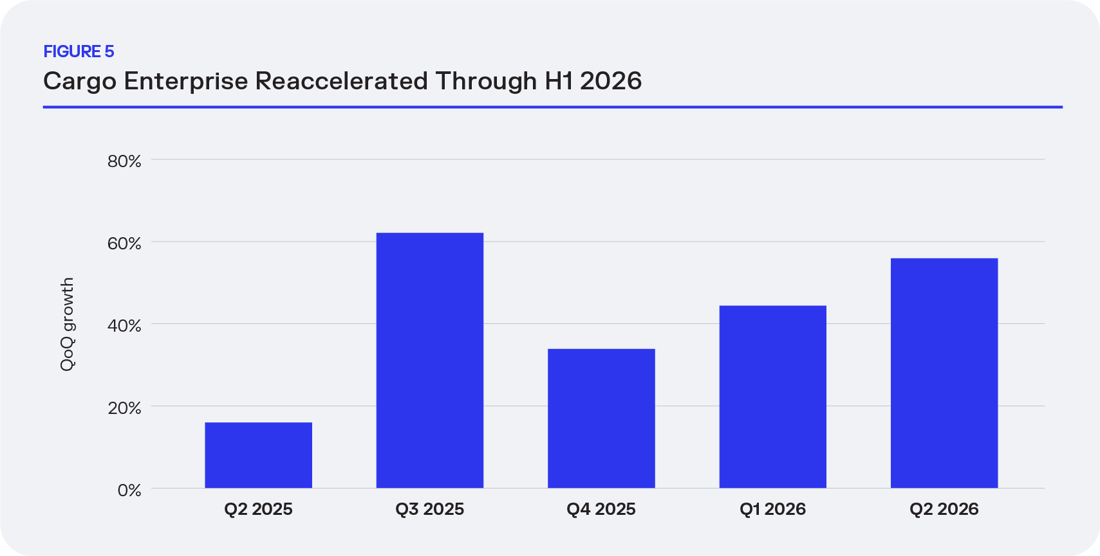
Figure 5: Measured enterprise adoption of Cargo was nearly 4.9 times its Q2 2025 level in Q2 2026, including 56% growth from the prior quarter.
This demonstrates that the public ecosystem’s expansion is increasingly translating into operational enterprise use. More organizations are actively managing Rust crates as part of their development infrastructure, even as the ecosystem itself continues to expand rapidly.
Cargo’s enterprise footprint is also broadly distributed across industries. Software and financial services each represent roughly 19% of observed adopters, while business services and manufacturing each account for about 18%. That distribution suggests Rust adoption is extending beyond a narrow technology-sector footprint.
Cargo’s audited requests totaled 553,808 in H1 2026, compared with 90,051 in H1 2025. Blocked or rejected requests rose to 6,266, with the observed rate increasing from 0.14% to 1.13%. The data does not tell us why the intervention rate increased, but it does show that as Cargo use expands, enterprise policies are being asked to make materially more decisions about what enters development.
Cargo’s growth represents supply and enterprise adoption accelerating together. Cargo remains earlier in its enterprise maturity curve than Go, but the public ecosystem is expanding rapidly at the same time that enterprise use is broadening.
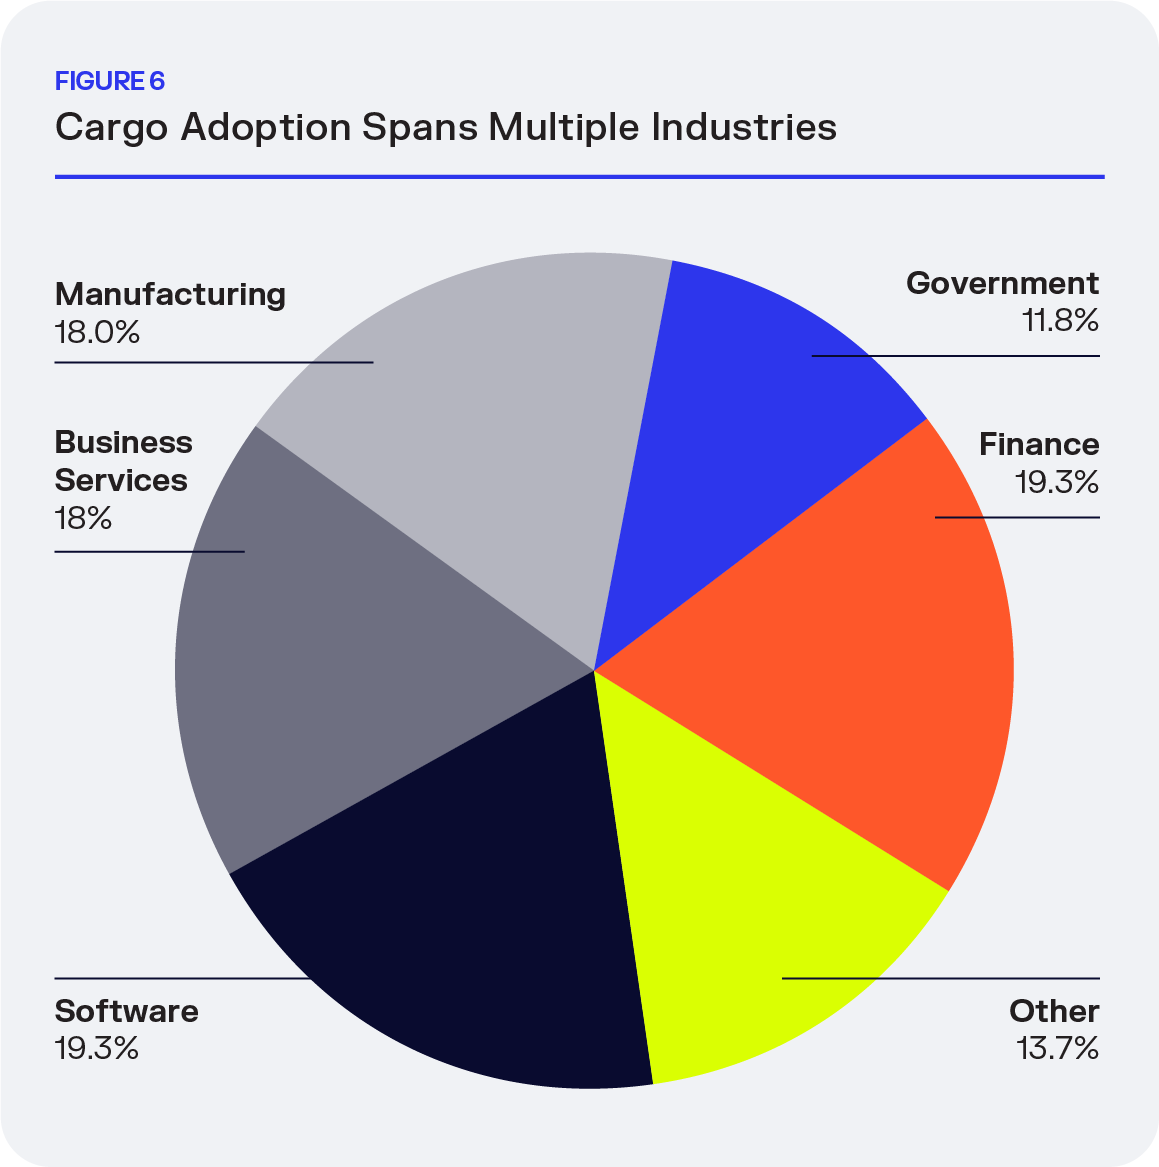
Figure 6: Cargo adoption spans industries: software and financial services each represented about 19% of observed adopters, with business services and manufacturing each near 18%.
Hugging Face Brings a New Class of Artifact to Enterprise Infrastructure
Rather than another language package ecosystem, Hugging Face growth represents the increasing presence of AI models and related artifacts in modern development infrastructure.
Hugging Face model creation rose from roughly 518,000 new models in H1 2023 to nearly 2.5 million in H1 2025, then fell sharply in H2 2025. It rebounded to nearly 1.3 million in H1 2026, which is still about half the H1 2025 peak. The pattern is volatile rather than a steady upward trajectory.
Repository creation followed a similar pattern. New Hugging Face repositories increased 358% from H1 2023 to H1 2025, rising from roughly 126,000 to 579,000. After declining in the second half of 2025, repository creation increased again in H1 2026 to more than 306,000.
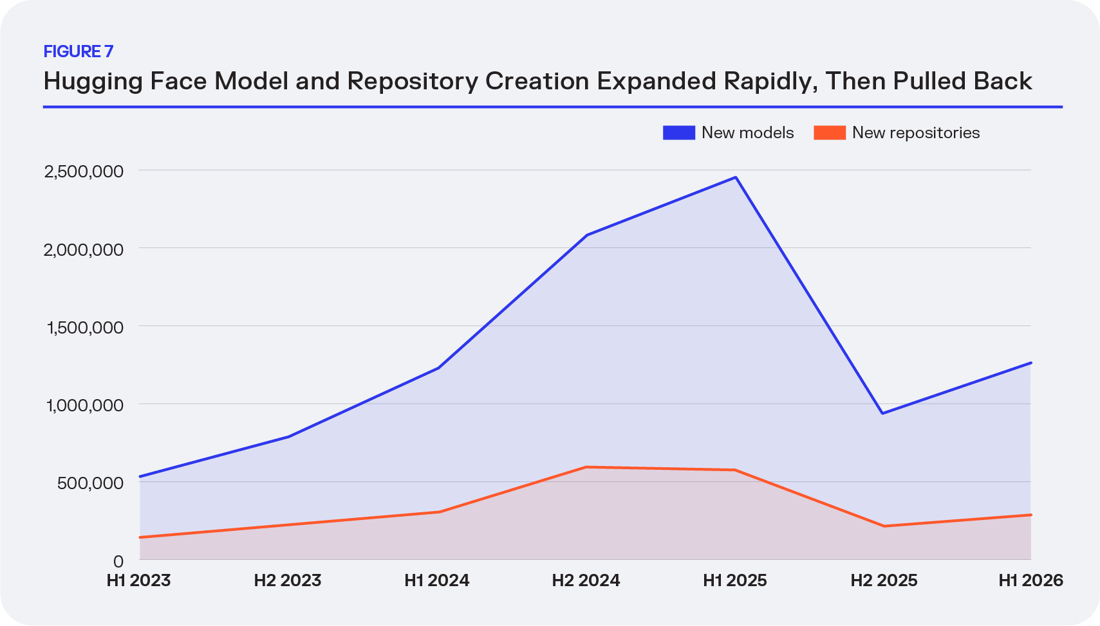
Figure 7: Hugging Face model and repository creation rose through H1 2025, fell in H2 2025, and rebounded in H1 2026; model creation remained about half its H1 2025 peak.
Enterprise adoption is expanding quickly as well. Hugging Face appears in nearly 6% of the measured Nexus Repository population, and Q2 2026 saw nearly 4.7 times as many adopting organizations as Q2 2025.
That adoption is notable for where it is occurring. Financial services represents about 29% of observed Hugging Face adopters, while government accounts for 20%. Making up half of the observed adopter base, AI artifact management is already becoming relevant in environments where governance and control tend to matter heavily.
Hugging Face is already entering enterprise policy workflows as well. In the measured set of customers with policy activity, 31.8% evaluated at least one Hugging Face model against enterprise policies.
In H1 2026, Sonatype observed 9,658 audited model requests, with 6.98% blocked or rejected. The request volume is much smaller than for Go or Cargo, and the higher rate should not be interpreted as evidence that Hugging Face artifacts are inherently riskier.
Financial Services represents 29% and government accounts for 20% of observed hugging face adopters.
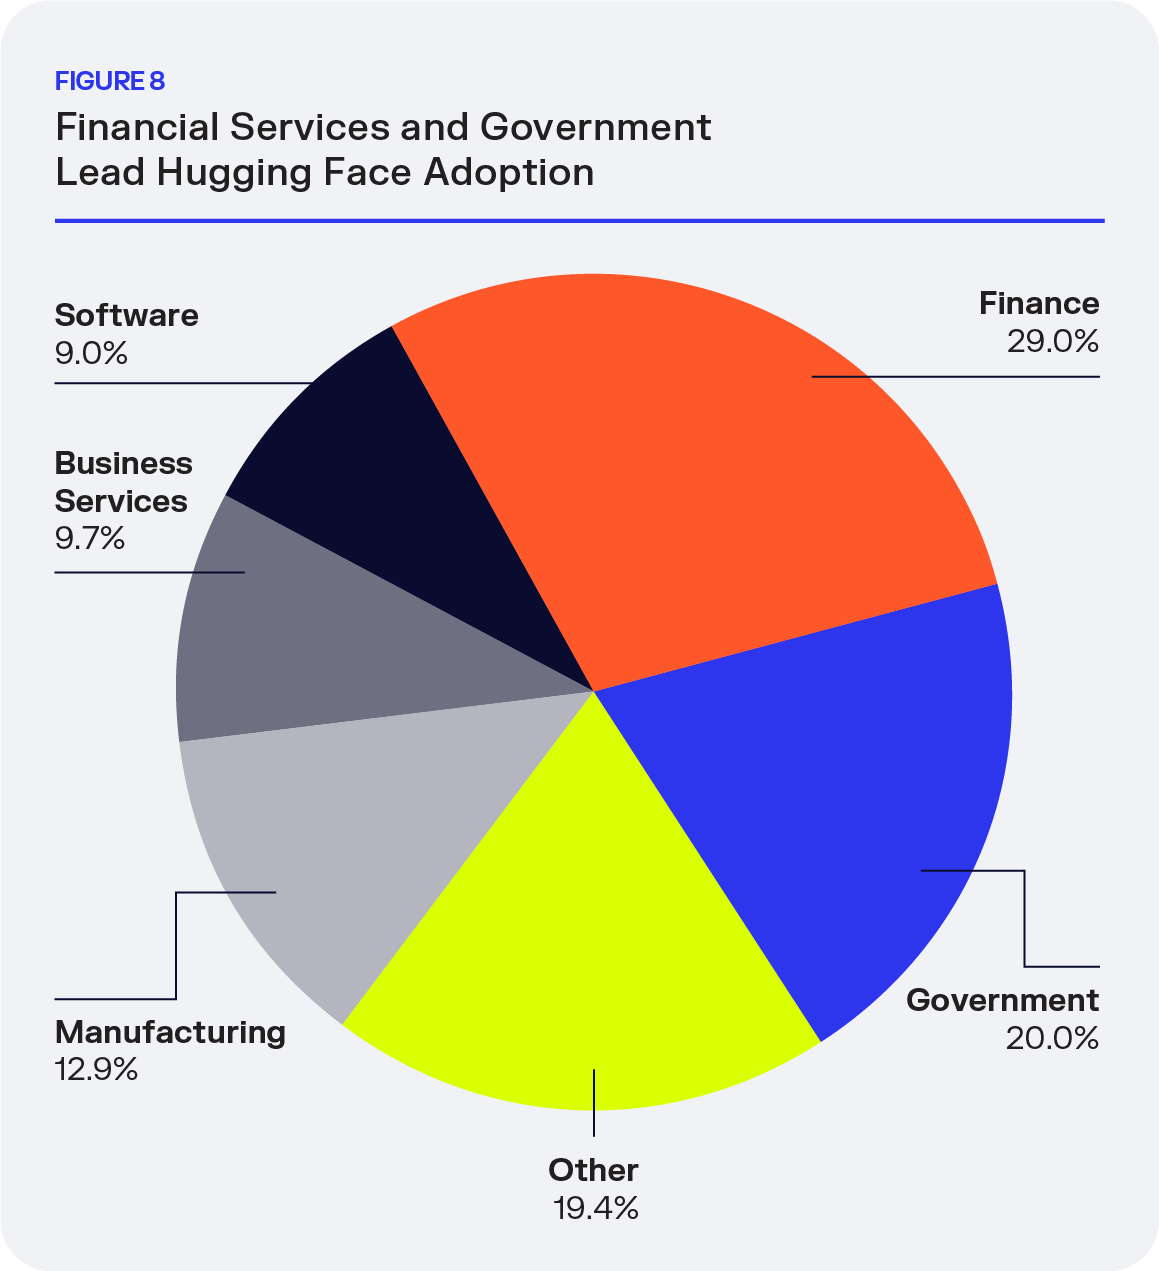
Figure 8: Financial services and government together accounted for about half of observed Hugging Face adopters, at approximately 29% and 20%, respectively.
AI Artifacts Call for Broader Governance
Conventional component policies often focus on whether a dependency’s license is acceptable and whether it has known vulnerabilities. AI governance needs to assess more: the model’s quality and safety, and how it may behave in the intended context.
The risks can also be less predictable: an AI failure may produce outputs or cause downstream effects that are harder to anticipate than the failure of a conventional software component. Because AI artifacts introduce these additional considerations, they call for a different governance approach.
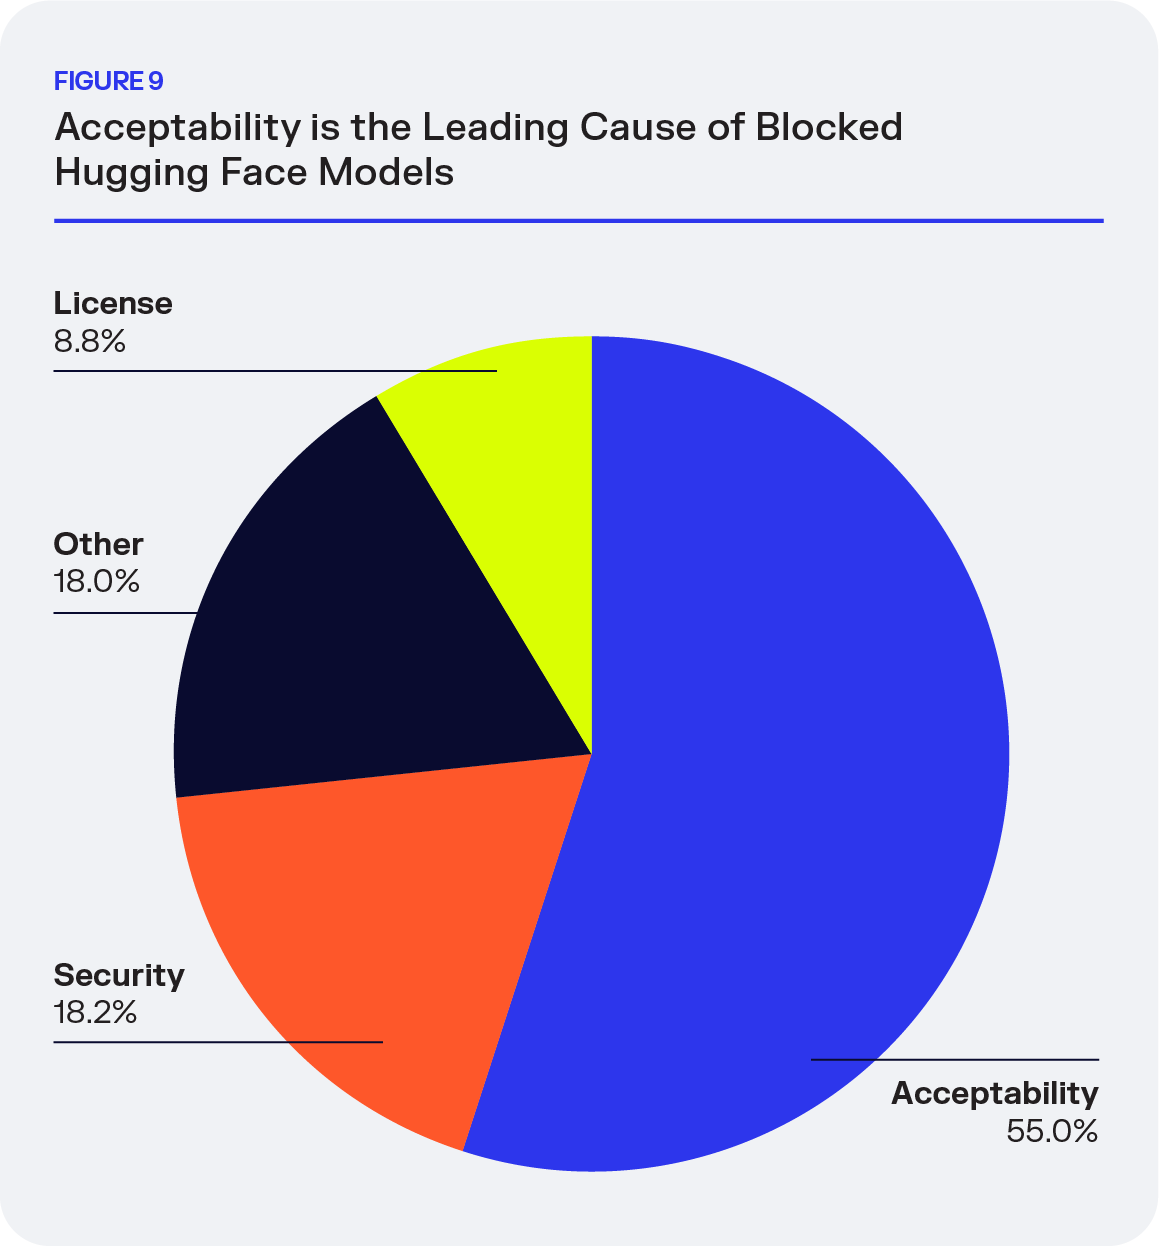
In H1 2026, 674 Hugging Face models were blocked or rejected in the measured policy data. Model acceptability was the largest recorded threat category, accounting for 55%. Security accounted for 18.2%, and license for 8.8%. The remaining blocked models were due to a variety of reasons, such as proprietary packages, unsupported origins, unidentifiable components, or other organization-specific policies. This shows that acceptability concerns were a major recorded reason for intervention, though the data does not specify which specific issues triggered a block.
AI models also raise governance questions that traditional open source policies were not designed to address. Teams may need to assess a model’s acceptability and safety, as well as the quality and integrity of its underlying data and weights. These considerations extend beyond familiar checks such as licensing and known vulnerabilities, and can shape whether a model is suitable for a particular use.
Hugging Face is still earlier in its enterprise adoption curve than Go and Cargo, but the data shows that AI models and related artifacts are already moving from public availability into managed enterprise environments. For platform and security teams, that changes the definition of what an enterprise repository needs to handle. The next important dependency may not look like a traditional package at all.
The next important dependency may not look like a traditional package at all.
What the Data Suggests About the Next Enterprise Supply Chain
The software supply chain is no longer defined by a small set of familiar package formats. Go, Cargo, and Hugging Face show three different ways newer artifact types can move from public ecosystems into enterprise infrastructure.
-
Public growth is an early signal, not the same thing as enterprise adoption
Public supply shows where ecosystems are expanding, but repository telemetry shows when those ecosystems become operationally relevant inside enterprises. Those two do not always move at the same pace.
Go is already well established in enterprise repositories even as public module creation accelerates. Cargo shows public supply and enterprise adoption rising quickly together. Hugging Face shows a newer class of artifact beginning to cross into managed enterprise environments.
-
Enterprise adoption can accelerate before an artifact ecosystem becomes ubiquitous
Waiting for an ecosystem to look “mainstream” can mean waiting until developers and development systems are already depending on it.
Across the three artifact ecosystems studied, enterprise adoption is already visible across financial services, government, manufacturing, business services, and technology. That makes newer artifact types an infrastructure question, not simply an early-adopter or developer-preference trend.
-
Governance has to follow the artifact, not the category
Governance activity is rising as these ecosystems enter enterprise environments. Go modules, Rust crates, and AI models behave differently, but enterprises still need to answer the basic questions: What is entering development? Where did it come from? Is it allowed? And what policy should apply to it?
As AI artifact adoption continues to scale, enterprise policy will expand to match, although the shape of that policy will look different. Metrics that were irrelevant for traditional open source components, such as quality or data fidelity, will increasingly impact developer choices.
Put simply, the pattern is public supply → enterprise adoption → governance. The formats may differ, but the operational challenge is consistent: enterprise infrastructure has to keep pace with how software is actually being assembled.
Put simply, the pattern is
PUBLIC SUPPLY → ENTERPRISE ADOPTION → GOVERNANCE
The formats may differ, but the operational challenge is consistent: enterprise infrastructure has to keep pace with how software is actually being assembled.
How Teams Should Prepare
For platform engineering and security teams, the implication is to build for a supply chain where the next important artifact may not look like the last one. The findings show that Go modules, Rust crates, and AI artifacts are already appearing in measured enterprise environments and policy workflows. Teams can use that signal to:
- Inventory what is in use. Check which ecosystems and artifact types are entering builds, including those not covered by formal adoption plans.
- Apply consistent intake and tracking to all components, including AI models. Record a model’s origin, license, and file format, and assess model-file loading risks as part of the intake process.
- Use a controlled dependency path. Route dependencies through an approved proxy or internal mirror so teams can observe use and apply policy consistently.
- Review policy coverage across formats. Check that relevant license, vulnerability, malware, and package-age rules cover the ecosystems the organization uses.
- Keep dependency records current. Ensure software bills of materials and related inventories capture Go modules, Rust crates, and AI models where applicable.
The repository is a strategic control point in that changing supply chain: it can provide visibility into what developers and AI agents are bringing into development and help teams apply governance before those inputs reach a build. As artifact ecosystems evolve, that visibility and control can help organizations adapt their policies while keeping development moving.
The repository is a strategic control point in that changing supply chain.
Study Scope and Methodology
This study examines the growth and enterprise adoption of Go, Cargo, and Hugging Face artifacts using public ecosystem data and anonymized Nexus Repository telemetry.
Public ecosystem data measures the creation of new packages, versions, models, and repositories within the available collection periods, including data through June 2026 for the H1 2026 analysis. These figures represent changes in publicly available software and AI supply. They should not be interpreted as direct measures of enterprise consumption, and the units are not directly comparable across ecosystems: a Go module, Cargo package, Hugging Face model, and Hugging Face repository represent different types of artifacts with different publishing and consumption patterns.
Nexus Repository enterprise adoption data uses anonymized telemetry from measured enterprise environments from 2024 through the first half of 2026. It examines whether the selected formats are present within those environments and how adoption changes over time. Customer counts and adoption rates reflect the observed population available for each format and period and should not be interpreted as estimates of adoption across all enterprises. Each format has distinct timeframes for data collection due to availability in Nexus Repository: Go data availability started January 2024, Cargo dataset spans October 2024-H1 2026, and the Hugging Face dataset starts in February 2025.
Nexus Repository policy activity examines audited component requests and blocked or rejected requests for the same ecosystems within the available telemetry. Block and rejection rates represent policy outcomes within the observed population. They may be influenced by differences in customer configuration, request volume, artifact type, and consumption patterns, and should not be interpreted as evidence that one ecosystem is inherently more malicious, vulnerable, or risky than another.
Together, the datasets provide three different views of how emerging ecosystems move through the software supply chain:
- Public supply: what ecosystems are producing and making available.
- Enterprise adoption: what is appearing in measured enterprise repositories.
- Policy activity: what enterprise policies are being asked to evaluate, allow, block, or reject.
Data availability, collection windows, and population sizes vary by ecosystem. Comparisons should therefore be made within the measurement periods and populations available for each dataset rather than treated as perfectly equivalent longitudinal histories across Go, Cargo, and Hugging Face.
Build a Better Control Point