Project Quality Metrics


It's clear from the previous section that development teams are integrating more open source software every year. But not all open source projects are equal. Teams need to use projects of the highest quality (fast update cycles, few unexpected API changes, etc.) and are least likely to contain security vulnerabilities. A number of project quality metrics have been developed to measure the best practices that support low vulnerability rates, code stability, and developer responsiveness.
In last year's report, we explored the efficacy of some of these metrics. This past year has continued to see an evolution in measuring the quality of open source projects. Since last year's report, the Open Source Security Foundation has defined an aggregate metric to summarize the various dimensions of project security, an important aspect of code quality, measured by their Scorecard framework. Tidelift has continued to update its SourceRank metric and has added additional projects to its list of Tidelift-supported projects.
In this section, we examine these metrics and Sonatype's MTTU (Mean Time to Update) metric to determine the relationship between security risk and project quality metrics.
We performed three levels of analysis:

A series of statistical tests to determine whether any single metric can be used to identify whether a project is more likely to have a known vulnerability.

A modeling exercise to determine if a combination of quality metrics can be used to identify non-vulnerable components.

An analysis of transitive vulnerability risk and whether various quality metrics are associated with decreased risk of inheriting vulnerabilities from transitive dependencies.
The Data
We combined the following data sources to enable the analysis described in this section:
- Project Data: 7.9 million releases of over 420 thousand Java projects hosted in Maven Central.
- Vulnerability Data: A set of over 14 million Common Vulnerabilities and Exposures (CVE) reports for these projects, drawn from the National Vulnerability Database, various public vulnerability feeds, and Sonatype's proprietary vulnerability analysis work.
- Commonly-used Projects List: A list of 60,648 open source projects occurring frequently in application security scans
- Project Versions List For Previous Year: A list of the project versions used in application builds since November 2020.
- Dependency Relationships: A list of all dependencies for each project release.
- Libraries.io Sourcerank Ratings: A list of ratings according to the Libraries.io SourceRank project rating, provided by Tidelift.
- OpenSSF Security Scorecard: An aggregate measure of project security practices developed by the Open Source Security Foundation.
- Security Scorecard Metrics: The individual project quality measurements that feed into the Scorecard Score above.
- OpenSSF Criticality: This measures a project's influence and importance, i.e., how critical is this project to the open source ecosystem and how much is it relied upon.
- Mean Time To Update (MTTU) Metric: A measure of how quickly a project updates its dependencies when new versions are released. Measures the average number of days it takes a project to incorporate a newly-released version of a dependency.
- Popularity: Data on the number of Maven Central downloads for each project.
In our analyses, we focus on the known vulnerabilities found in commonly-used projects and their dependencies and are limited to versions used in application builds in the last year.
Because enterprise software teams commonly use these projects, this ensures our findings are applicable to open source management decisions commonly faced by these organizations.
Popularity and the Vulnerability Economy
Understanding how the vulnerability discovery process works will help clarify the connection between project quality metrics and security vulnerabilities. When people discover flaws in software — whether unintentionally, via normal usage, or intentionally as a result of research or hacking activities — is when they discover vulnerabilities. While malicious hackers and security researchers might not have a lot in common, one thing they do share is the desire to maximize their work's value.
So despite the differences in their intent, they both target popular libraries over more niche or inactive projects to maximize the impact of their efforts. That means more popular projects are more likely to have a security-relevant bug or finding discovered in their codebase. As a result of these factors, more popular projects tend to have significantly more known vulnerabilities without necessarily implying those projects have more inherent vulnerabilities. We've observed this connection between popularity and identified vulnerabilities in previous reports.
The connection between popularity and security is important to note because both the OpenSSF Criticality metric and the Libraries.io SourceRank metric include popularity measures in their formulas.

Vulnerabilities are discovered via normal usage, as a result of security research, or hacking activities.
Characterizing Vulnerable Projects
Statistical Tests
We first performed some basic statistical tests to determine if there are any simple relationships between quality metrics and project vulnerability. This relationship would be a strong correlation between a metric and vulnerability. For example, if a better SourceRank score tended to correspond to a lower rate of vulnerability, then developers could include SourceRank in their list of considerations when choosing a new component. A dev team looking for an HTTP library to add to their application could then choose the library that has a higher SourceRank score and be confident this would result in better security.
Unfortunately, such a simple relationship does not exist. None of the quality metrics had even moderate correlation with vulnerability count. Since no useful relationships were found, we moved to machine learning-based classification techniques to see if a combination of project quality attributes could be used to predict which projects would have the most vulnerabilities.
None of the quality metrics had even moderate correlation with vulnerability count.
Machine Learning
Since no simple relationship between quality metrics and vulnerability activity was found, we considered whether a more complex combination of project quality metrics could lead to a strong connection with vulnerability data. To do this, we trained several machine learning models (using random forest-based classification) to predict whether a project was vulnerable based on various subsets of: OpenSSF Criticality, Security Scorecard (aggregate score and individual checks), Libraries.io SourceRank, MTTU, and Popularity.
We performed this training using a dataset of 12,786 projects that had data for all attributes. To ensure that we were not over-fitting the data, we performed cross-validation with 80% of the data used for training and 20% used to test model performance.
Using Aggregate Measures
Our first experiment involved providing the model with OpenSSF Criticality, Security Scorecard, Libraries.io SourceRank, MTTU, and Popularity.
Results showed that a combination of these different quality metrics can be highly effective at identifying vulnerable projects. With all quality metrics included, we obtain a remarkable 95.5% precision and 95.5% recall. This means that 95.5% of the time, the model correctly identifies projects with known vulnerabilities, indicating that project quality metrics really do measure important factors that contribute to security.
Figure 2.1. Relative Importance of Quality Metrics in Research Model
Figure 2.1 the relative importance of each feature in the model. To compute the importance of a feature, we built a model excluding it and measured the degradation in performance. Total downloads was the most important attribute — not surprising given the correlation between popularity and vulnerability. MTTU was the second most important, indicating that dependency update behavior signals project quality. In order, the next most important were Scorecard, Criticality, and SourceRank.
Scorecard Checks
Because OpenSSF publishes the individual checks that feed into their Scorecard Score, we were able to test how well a model based solely on these software development best practices could correctly identify projects with known vulnerabilities. When provided as separate features to the machine learning process, we obtained accuracy of 89% (86% precision and 87% recall) for this Scorecard-based model — not much below the performance of the model that used the aggregate metrics. This shows that the individual Scorecard measures are very useful on their own.
Figure 2.2. elements most useful for identifying vulnerable projects
We also performed the same importance measurement to determine which practices are most important. Figure 2.2 shows which elements of the Security Scorecard were most useful for identifying vulnerable projects. Not surprisingly, code review emerges as the most important factor. Code review has long been identified as a high-impact practice that can substantially improve code quality. Binaries provide another attack path, decrease transparency, and reduce auditability of code. So, not having them checked into the repository was the second most important factor. Pinning dependencies was the third most important factor, hinting at the importance of dependency management in maintaining secure software. Branch protection, which enables a formal approval process for code changes and pairs well with code review, was the next most important factor.
Building a New Metric
The effectiveness of these various models leads to an interesting question: can we build a metric based on one of these machine learning models that provides a good predictor of future vulnerabilities? We believe the answer is yes, and we've taken the first step toward this by developing a new metric that accurately associates quality measures with past vulnerability patterns.
We are releasing this metric publicly by applying it to widely used open source software components and making that data available in our public data sources: OSS Index and Maven Central. That way, the community can participate in vetting the metric and track whether higher-scoring projects indeed prove less prone to vulnerability discovery than lower-scoring projects.
Avoiding Popularity Bias
In the AI community, there is a famous story warning that machine learning models can end up focusing on unintended features of the data. A student was training a model to identify whether an animal in a photo is a dog or a wolf. The model achieved high accuracy and seemed to work well until it was provided with a new set of photos. This revealed that the model wasn't detecting subtle differences in ear shape or build, but rather was simply identifying whether the photo contained snow. All of the original photos of wolves were taken in snowy conditions, while the pictures of dogs were in backyards or parks with visible grass. It's important for an effective model to avoid such bias and mitigate the risk of popularity affecting scoring based on the relationship noted earlier in this section: that more popular projects tend to have more known vulnerabilities, possibly as a result of getting more scrutiny. The model needs to learn the connection between development practices and vulnerability, rather than popularity and vulnerability. Our hypothesis is that focusing on development practices will yield a model that provides better predictive value since development best practices are meant to improve the inherent quality of a codebase.
In the previous section, we noted that various combinations of features could be used to obtain high accuracy, so we have flexibility in which features we choose to include in the training process. We thus choose to avoid features that are influenced by popularity. This means avoiding the OpenSSF Criticality metric (which includes a count of the number of projects using a component as a dependency), the Maven Central download count (a direct measure of popularity on Maven Central), and the SourceRank metric (which includes “stars” and “subscribers,” two measures of popularity). This leaves us with the individual Security Scorecard checks and MTTU, which we combine with the vulnerability data and provide as input to the learning process (our dataset for this experiment consists of 31,515 projects). For projects where MTTU does not apply (e.g., projects with no dependencies), we use a separate model trained with just Scorecard checks.
This results in a model identifying which development practices are common to projects with a “clean” vulnerability history (no known vulnerabilities in recent versions). Projects that implement those practices then score higher in the resulting metric. Because of the power of the modeling approach we use (random forest classification), the model can learn complex associations between attributes. For example, if code review is only useful when branch protection is also enabled, then this fact can be recognized and captured by the algorithm.
This model, trained on the Scorecard checks and MTTU was 86% accurate in identifying projects with known vulnerabilities (88% precision, 84% recall).
Converting to a Rating
The training process described above results in a model that can classify a project as “vulnerable” or “not vulnerable” based on its development practices as recorded by the Scorecard checks and MTTU. To obtain a rating, we need to convert this Boolean result to a numeric measure of the relative safety of a project.
To do this, we take the confidence of the model and scale it to obtain a measure of how likely a project is to have no known vulnerabilities. This scaled result becomes the basis for a safety rating for a project with projects rated on a scale of one to ten, with one being the least safe and ten being the safest. If the model is confident that a project will not be vulnerable based on its Scorecard checks and MTTU then it will receive a very high rating. If the model is confident the project will be vulnerable, then it receives a very low rating. Projects where the model is less confident rate in the middle, depending on how much the model is leaning toward “not vulnerable.” This process results in a novel method of weighting the Security Scorecard checks plus MTTU to obtain an aggregate score and project rating called the “Sonatype Safety Rating.”
We are hopeful that this machine learning-based approach to rating projects will provide better predictive value than existing quality metrics, and are soliciting feedback from the community. OSS Index and Maven Central now include a Sonatype Safety Rating for 31,515 of the most widely used projects that contain the required Security Scorecard data. Over time, we intend to expand the set of projects that we rate and enhance the rating algorithm itself.
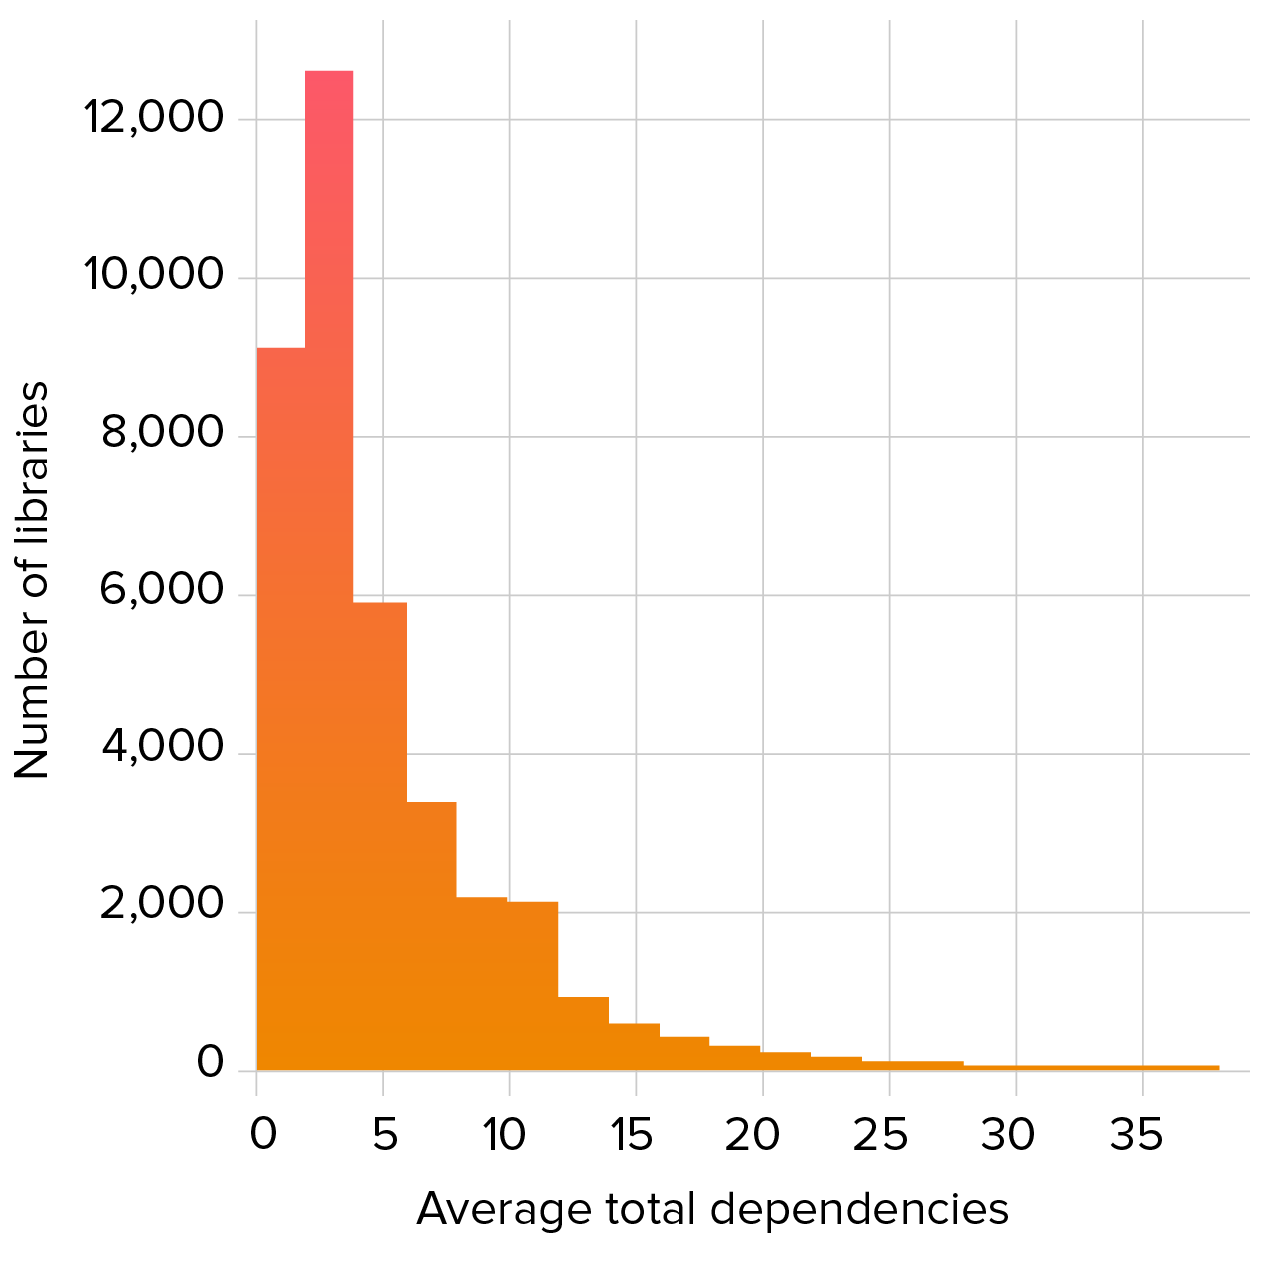
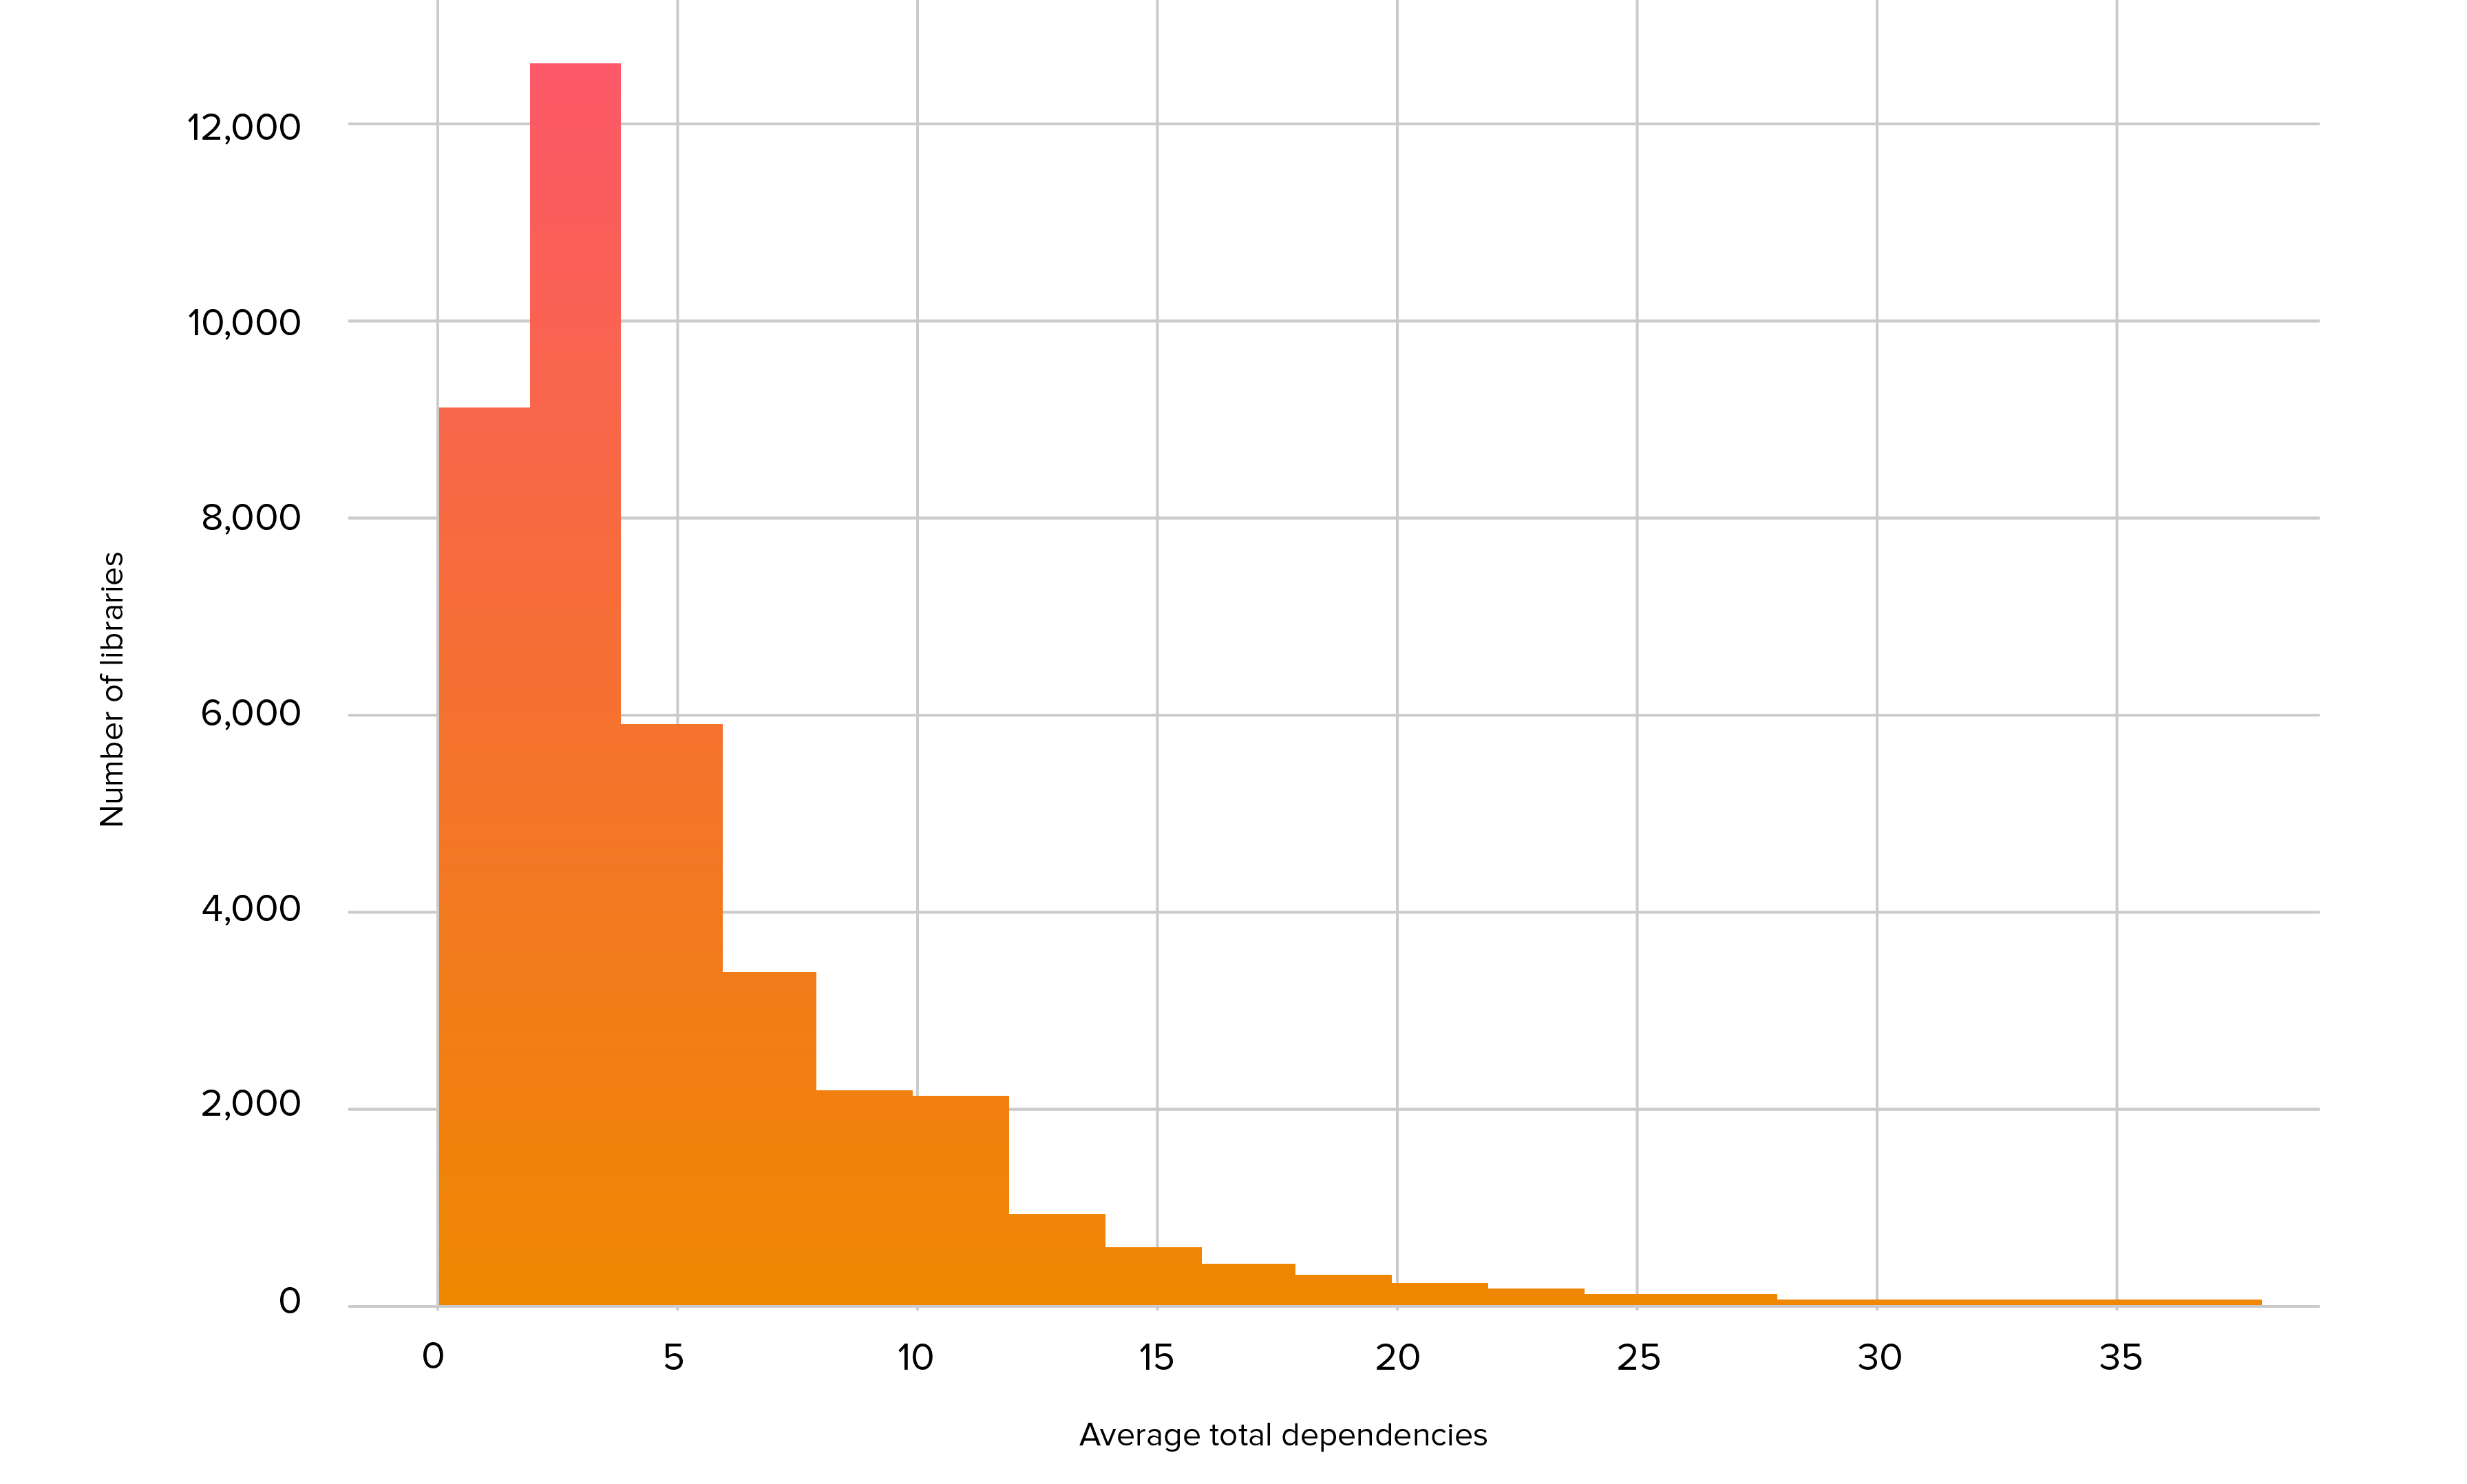
Transitive Vulnerabilities
It is common for open source libraries to rely on other libraries to handle common tasks such as logging or to build on or combine features from other libraries. These “dependencies of dependencies” are called transitive dependencies and can be a major source of security risk, since a vulnerability in a transitive dependency is inherited by every library that uses it. Figure 2.3 shows a histogram of the number of dependencies for our set of commonly-used libraries. On average, a library contained 5.7 dependencies.
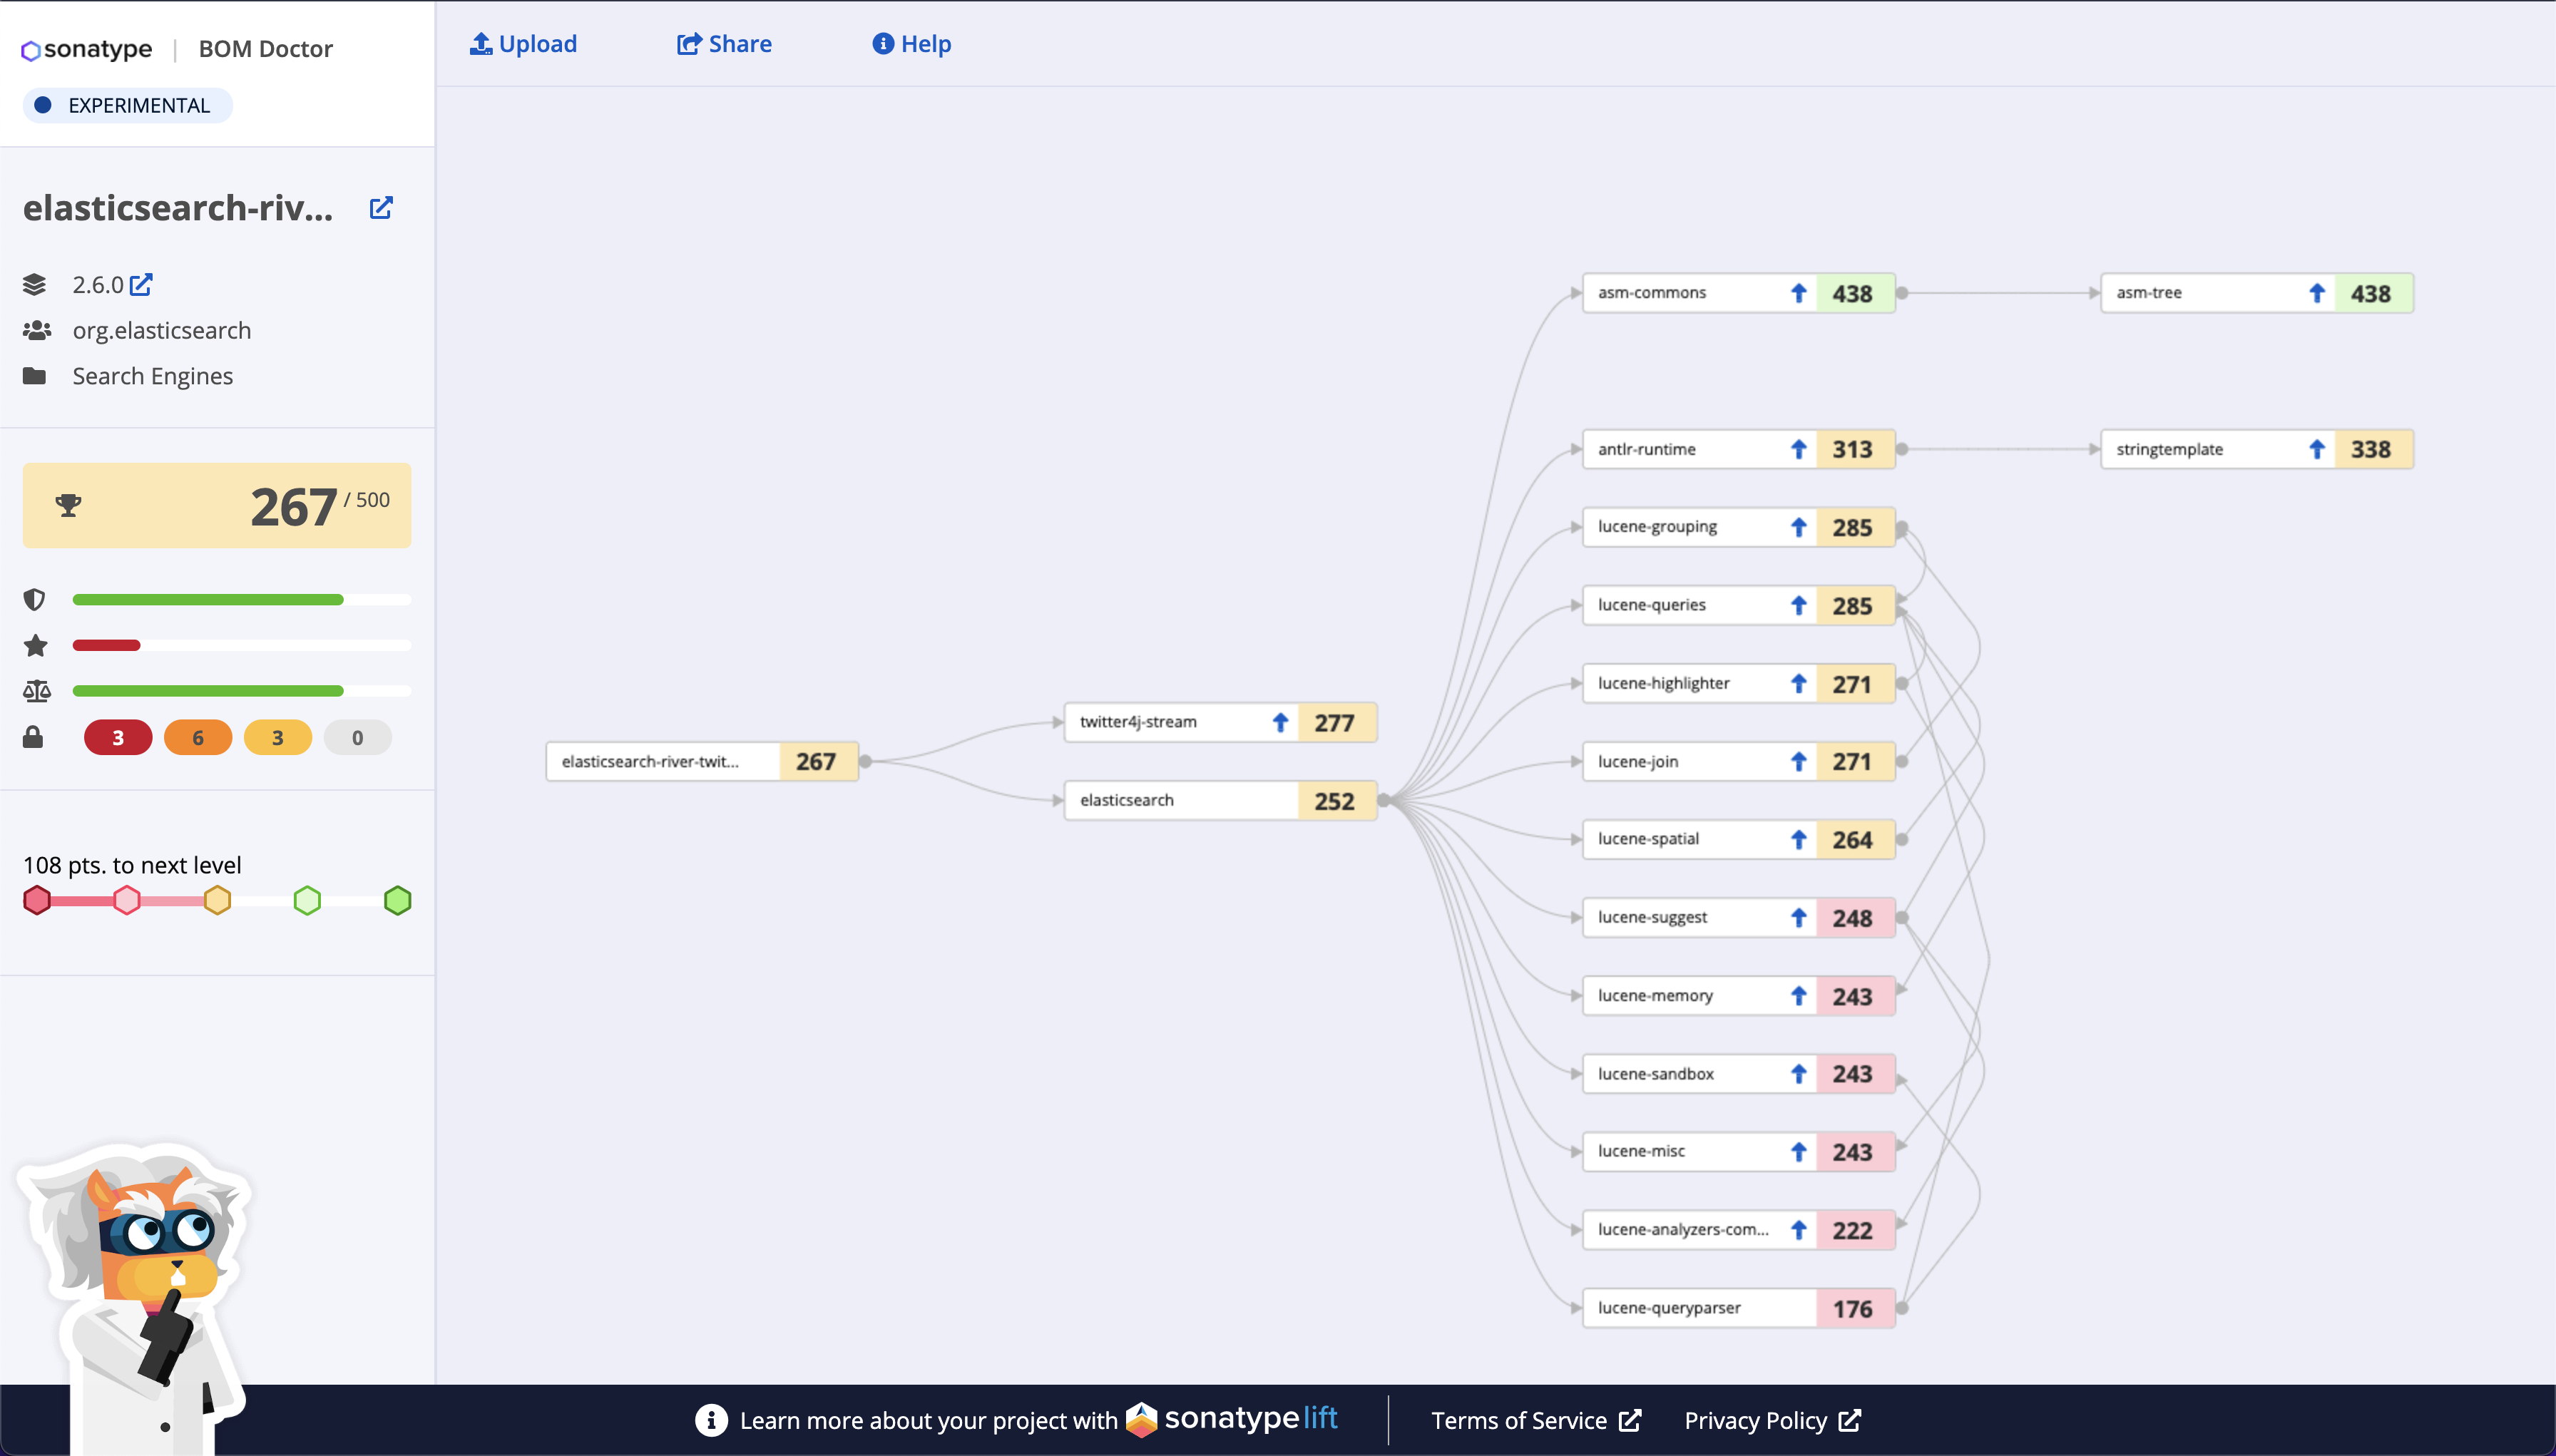
Figure 2.3. Average total dependencies in commonly-used libraries
When analysis includes these transitive dependencies, the number of vulnerable projects increases significantly. While only 10% of these projects had a vulnerability directly affecting the code in that project, 62% had a direct security issue or a transitive vulnerability arising from their third-party dependency tree.
Because of the importance of transitive vulnerabilities, we wanted to see which quality metrics helped minimize transitive security risk. By far, the biggest contributing factor to transitive vulnerability risk is the number of dependencies. The correlation between the number of dependencies and direct or transitive vulnerabilities is 75%, which explains 67% of the variance. Adding MTTU into the model incrementally improved performance and explains 69% of the variance.
This is consistent with general advice to carefully consider each dependency added to a project, take care to minimize dependencies, and, when adding dependencies, choose those with a lower MTTU (which are faster at patching issues in transitive dependencies).
Conclusion
In our research and analysis we found less correlation between leading quality metrics and project security than we expected. In retrospect, this is not surprising given that vulnerability discovery is a complex process involving multiple human-driven processes. Developers collaborate to produce high-quality code, leveraging common processes such as code review, but use those processes in a variety of different ways, influenced by culture, project goals, community involvement, and other factors.
At the same time, vulnerability researchers and hackers engage in their own process of looking for security bugs and deciding which projects to focus their effort on. This human-driven triaging involves a high degree of randomness/luck. Both stringent code quality practices and vulnerability discovery practices focus heavily on the most popular projects, leading to the unintuitive result that projects scoring higher on quality measures that incorporate popularity may actually have more known vulnerabilities discovered in them, even if those projects don't have more actual vulnerabilities.
Still, our research has shown that while there are no straightforward relationships between quality metrics and security outcomes, machine learning models can tell a lot from combining the metrics that exist to achieve very high accuracy in labeling projects as likely to have known vulnerabilities. So far this is an observation about what can be understood from information available at a particular point in time.
From our analysis, and in part because of this bias risk, our research revealed that while there are no straightforward relationships between previously-proposed quality metrics and security outcomes, machine learning models can achieve very high accuracy by combining metrics. We used machine learning across a variety of metrics to develop a new safety metric, the Sonatype Safety Rating, which predicts project security based on development practices. This rating corresponds closely to vulnerability: 88% of projects with a Sonatype Safety Rating less than five have a known vulnerability.

Research Insight
Carefully consider every library added to your project. Prefer libraries with smaller dependency trees and look for projects that are quick to update when new versions of their dependencies are released.
Two critical factors for reducing the risk of transitive vulnerabilities are minimizing the total number of dependencies and maintaining low update times.
Our analysis so far is based on comparing historical known vulnerability rates and actual development practices to learn how these practices influence the likelihood of vulnerabilities. We have not established that these machine learning models can predict future vulnerability, which we can only learn over time. Thus, we will be monitoring the projects in our dataset over the next year to see if high-scoring projects are associated with lower vulnerability rates over time-and will report those findings in next year's report.
In the meantime, we continue to recommend that developers select components with a better MTTU, Security Scorecard, OpenSSF Criticality, and SourceRank in that order. We understand trying to aggregate and weigh the various scores may be difficult. We've made it easier by adding the new Sonatype Safety Rating to our public vulnerability database OSS Index. We'll be rating new components over time, beginning with the most popular projects that have the required Security Scorecard data that feeds into the rating. Additionally, as stewards of Maven Central, we're also adding the Sonatype Safety Rating to components uploaded to Maven Central, focusing again on the most commonly downloaded components first that have Security Scorecard data.
Finally, since most vulnerabilities arise from transitive dependencies, the clearest guidance is to carefully consider every library you use. Favor ones with smaller dependency trees. Look for projects that are quick to update when new versions of their dependencies are released (low MTTU). Minimizing the total number of dependencies and maintaining low update times for your own project's dependencies are two critical factors for reducing the risk of transitive vulnerabilities.
This advice holds true not just for consumers of open source components but also open source maintainers. Projects adopting the practices set out by the OpenSSF in its Security Score, including adopting a dependency update tool that ensures rapid updating of vulnerable dependencies, will improve their project's security and the security of the open source projects that depend on them.